Leaderboard


Popular Content
Showing content with the highest reputation on 06/15/2016 in all areas
-
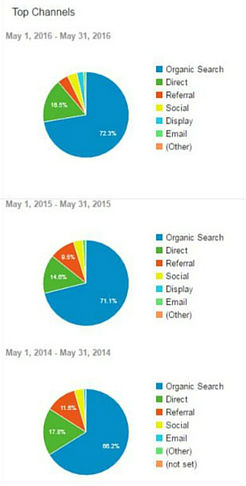
I'm not sure if the graph on the right is legible, but it depicts the source of AALBC.com's traffic for the three month periods, May 2016, May 2015, and May 2014. For each of these periods more than 90% of my traffic comes from three sources Organic Search (visitors who arrive at the site as a result of a query on a search engine), Direct Traffic (visitor entering a URL directly or clicking a bookmark), and Referral Traffic from other websites. I picked May because it is a typical month, not the busiest month, usually February (Black History) and November (holiday shopping), nor the slowest month usually July (vacation time). While I'm not sharing my specific numbers, just percentages, the information should still be useful. AALBC.com's Website traffic has also steadily increased and improved on virtually every single metric. The website's upgrade which has been ongoing for the past 6 month, and will probably take a year to complete, has resulted in an anticipated improvement in engagement, based upon the average number of pages views, per visit. The number of pages viewed per visit more than doubled since 2014. This is on top of an increase in the number of overall visitors which continues to grow each year; up 108% from 2013, 80% from 2014, and 68% from 2015 for the month of May. Social Media (Facebook, Twitter, etc) has held steady at roughly 3% the past year I've greatly reduced the amount of time I spend engaging directly on social media--limiting my activity to posting links usually directly from the page I'm sharing, without visiting the social media site. So it is good to see that a tremendous reduction of time spent on social media has had no adverse impact on the traffic generated from social media. In fact, because website traffic is up overall that 3% actually an increase in visitors (all organic) from social media during the periods measured. The vast majority of social media referral come from Facebook, Twitter is a distant 2nd and all the others including Google+ and Pinterest are negligible sources of traffic to AALBC.com Referral traffic (visitors directed by hyperlink on other sites), as a function of percent of total traffic has declined steadily over the past three years dropping from approximately 12% to 3% of overall traffic. Referral traffic tends to be the highest quality traffic, visitors referred from other sites tend to stay on the site longer and view more websites than any other source. Sadly, the decline of referral traffic is due to a few reasons; (1) a decrease in the number of websites that historically linked to AALBC.com; (2) the trend of larger sites not to link to other websites; and (3) a trend toward Facebook away from standalone websites as one primary web presence. All of these problems feed on each other making the others worse. I've actually invested years trying to change this trend; obviously with little impact. All I can do is continue to link to other websites and continue to fight, because as referral traffic dries up, we all becoming increasingly dependent upon corporate website for traffic—which comes at a much higher cost. I'm sharing this information to potentially help other webmasters by giving them another website to which they can compare their stats and ideally, figure out ways to improve their traffic.
 1 point
 -
Troy You asked an excellent question that I've found myself asking many women over the years..especially those who claim to be irreligious. WHO told you monogamy was the "right" thing? As far as I'm concerned it's a matter of preference....choice. Most men are polygamous and prefer multiple parnters. Most women are monogamous and prefer the comfort of a secure single relationship. Harmony comes when both groups respect the desires and preferences of the other and work along those lines. The above book was clearly aimed at women because most men aren't waiting on "Ms Right". Ms Right for them is whoever they find attractive and is willing to sleep with them. It's a shame so many young women are being indoctinated into holding out for some mythical "knight in shining armor" who doesn't exist. I blame Hollywood for this and the fantastic (in the truest definition) standards it seems to set for so many young women. But concerning that book.... It's unrealistic and down right absurd for a couple of wealthy attractive relatively young people to sit back with grins on their faces telling the average man and woman to "wait". You learn about relationships by HAVING them and the trial and error of making mistakes. Telling people to wait for the perfect mate is like telling a young driver's ed student they should wait until the weather is 70 degrees and perfect before being taught how to drive. This sounds like some foolishness they picked up from thier priveledged White friends who have so much money and so many friends they have nothing better to do than play "relationship games"...lol. Lisa Brown I know you're young and fresh to the world so I'm gonna tell you the straight up truth and you can either accept it or reject it...but it you accept it relationships will be much easier and things will make more sense. Men cheat because they like sex with multiple women and if they told you the truth they know you wouldn't sleep with them....so they lie to you. Not all men cheat or have sex with multiple women. Some men are gay, others have a low sex drive where they don't want sex as much. But MOST men do....especially those under 40. That's a biological reality and there's NOTHING wrong with it. The only thing wrong is the MISEDUCATION of most women in this society concerning male biology and psychology. You've been TAUGHT that normal is wrong or bad....so now you must be UN-TAUGHT.1 point
-
Given that President Obama went around the Black establishment, he never needed the Black press. So why would he go through this venue?1 point
-
Actual journalists have been saying the worst "since 911," or the "worst mass shooting," or some other language which is accurate, while at the same time sufficiently sensational to draw in viewers. In the world of social media where people are sloppy with language, ignorant of history, have an agenda, or are Trump supporters, pointing our McVey as if anyone has forgotten about him would be necessary. Memes like this and social media where these things proliferate never capture the nuance or complexity of any situation. They are designed to illicit an emotional reaction. Of course there have been countless atrocities perpetrated on U.S. soil. Some make the shooting in Orlando look like a garden party. Which sadly makes it "just another day in the USA."1 point
-
My name is Dr. Robert Daylin Brown My new book is called "Joker to King: Your 52-Week Initiation into Manhood" Publication date is May 25, 2016 ISBN: 978-069272778 In December of 2012, my youngest brother (who was 21-years-old at the time) was having difficulties in life. He had already dropped out of two colleges, he was hanging with the wrong crowd, he lost his job, and he was thinking of doing something illegal out of desperation. Right after Christmas he called me and asked if I could teach him how to be a man. What followed was a series of lessons I wrote that gradually led my brother into responsible manhood. That series of manhood lessons became the foundation of my new book Joker to King: Your 52-Week Initiation into Manhood. Joker to King is the first book of its kind. While there are plenty of books that explore issues of masculinity and manhood, Joker to King is the first book that combines lessons, story examples, and real assignments for readers to practice each week in order to develop into stronger and substantially more responsible men. The 52 lessons in Joker to King are organized according to the 52 playing cards in a deck, allowing readers to practice their manhood lessons within a full 52-week calendar year. By the end of the book, readers will understand how to better manage relationships, manage and build resources, manage work and home environments, and most importantly, manage themselves. The link for the book's Amazon page can be found by clicking HERE. Thank you. --Dr. Brown www.RobertDaylinBrown.com1 point